
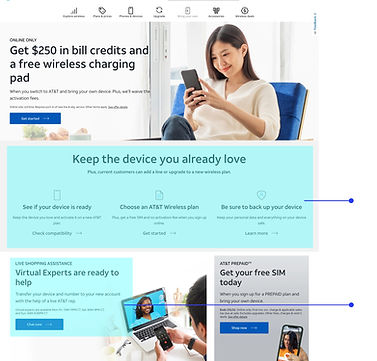
DO IT ONLINE

Accountable for the design and user experience for AT&T Do It Online page, its first all-inclusive service from the store to online in the United States. It resulted in an increase in online adoption of AT&T services by 18%. Improved AT&T's existing customer experience by shifting its traditional physical store presence to an all-inclusive online user journey and visual design presence.
Role
UX/UI Designer
Project Type
Webpage
Technology
Sketch
Collaborators
Lead Art Director,
Copywriter, Business Analyst, Strategist

THE PROBLEM
The long lines in-store during peak hours cause frustration to customers. At the same time, these customers find it difficult to navigate through pages on the AT&T website for the services they need.
DISCOVER
AT&T, like any other telecommunication provider, provides physical in-store services such as payment, product purchases, and general customer help services. According to data research, there are at least 37% of customers visit the physical store for customer services. This causes long lines in-store during peak hours. AT&T would like to provide an easier digital platform for customers seeking services.
HOW DO WE GET CUSTOMERS TO TRANSITION FROM IN-PERSON STORE SERVICES TO ALL-ONLINE SERVICES?

WHY IS THIS IMPORTANT TO AT&T?
There are a few pointers that make this important for AT&T. First, there is less reliance on physical stores, which means lesser waiting times for customers, and lesser delay operations for services that can be done online. There will be an increase in online page visits which will help with the business and overall, it will enhance the digital experience for the customers.
THE GOAL
Transition and enhance the ease of use to online customer service from physical stores while addressing the pain points of customers.

METHODOLOGY
To have a deeper understanding of the pain points, I worked together with 2 other UX designers and did research and design. The following are our processes.

RESEARCH &
DISCOVERY
DEFINE &
SCOPE
DEVELOP &
DESIGN
PROTOTYPE &
TESTING
RESEARCH & DISCOVERY
We did preliminary research to understand AT&T customers better and did a survey with in-store customers. We analyzed the common user journey of these customers and synthesized insights.

Prefer in store services
Difficulty navigating online
Interact with product
Interact with staff
Staff product knowledge
Staff inventory knowledge
Even as Millennials and Gen Z account for a growing number of consumers, the preference for in-store customer service experiences remains strong with all age groups. A majority of consumers (57%) generally prefer to seek services in physical stores as opposed to online.
The vast majority of consumers (85%) say that navigating online is difficult, given the amount of information that has to sift through.
65% prefer to interact with products.
Nearly half of consumers (46%) noted that the ability to deal with personnel directly is among their top-three reasons for being in physical stores. The research found that most consumers consider product knowledge (76%) and inventory knowledge (61%) among their top three most important qualities when dealing with in-store personnel.
WEB ANALYTICS
We looked at the heatmap data of the current AT&T pages that render online services as a reference. Based on the data, we synthesize that there is a consistent percentage of click-throughs for services. However, these are customers who regularly use online services.

USER PERSONA
To ensure we address the needs of AT&T customers, we derived 2 primary users from research and outlined their requirements.

Sarah Newman, 32
Artist in residence and a mother of two. Good with time management and tech savvy.
Wants
-
To have all the services on a page and easily accessible
-
To be able to do any services while on the go, webpage must be mobile friendly
Key Insights (Inferred from user interviews)
-
Likes to multi-task and do things on the go
-
Dislike when she can't find a service online easily

Paul Tan, 55
Entrepreneur. A people person who enjoys the presence of people around him.
Wants
-
To have reliable services, especially if he is busy, but would need to speak to a person
-
To be given an option he could choose whether online or in-person
Key Insights (Inferred from user interviews)
-
Would prefer to have a balance of personal services versus just doing it online
-
Would need services to be rendered easily
USER FLOW
We worked closely with stakeholders and strategists to create a holistic experience that would benefit both the customers and AT&T business.

DEVELOP & DESIGN
Based on the user flow and research. I created some wireframe variations for the do-it-online page, keeping in mind the business needs and customers' pain points.
Initial sketches


During this process, the strategists and business analysts insisted to showcase business opportunities for example, advertising wireless plans or new products. However, stakeholders would prefer the page simple, with less real estate.
Iteration 1
Iteration 2
Iteration 3


The iterations adopted the use of icons for easy visual reference when a customer visits the page. However, the placement of each component to advertise business opportunities has proven to be a distraction and derailed from the intent of the page and we decided to remove it and focus only services.
DEVELOP & DESIGN
The iconography is the main visual representation of each service rendered online. The visual cues are similar to the main pages for AT&T, giving a consistent and familiar user experience. The stakeholders have requested that the 'Track and set up new phone' component are important but should not take dominance on top of the funnel. The AT&T blue was used to highlight the component while the rest of the components remained neutral with the essence of AT&T blue on the icons. There were some non-existing icons that are suitable for the service, these are some of the icons I designed.
Icons
![AdobeStock_483393596_Preview [Converted]-01.png](https://static.wixstatic.com/media/ad3ffb_eaa503c231bb464382a71c00c5e95f18~mv2.png/v1/crop/x_917,y_689,w_4422,h_2517/fill/w_680,h_380,al_c,q_85,usm_0.66_1.00_0.01,enc_avif,quality_auto/AdobeStock_483393596_Preview%20%5BConverted%5D-01.png)
Desktop


Mobile


PROTOTYPE, TEST & RESULTS
We did on-site usability testing and users were delighted with the easy navigation to find the service they need on one page without the hassle of exploring other pages.
"I liked the walkthrough of it, it seemed intuitive to go from one task to the next.”
- User tester
"I would not imagine how easy it was for me to do this online, I saved a lot of time”
- User tester
"The icons helped a lot when I was on the page, I like that it is not too much of scrolling too”
- User tester
THE IMPACT
There was an increase in online adoption by 18% within the first month and services in the physical stores have reduced gradually. There are 60% page visits with a 2-minute average time while navigating.
18%
2
INCREASE IN ONLINE ADOPTION
MINUTES ON AVERAGE
TIME NAVIGATING
WHAT DID WE LEARN?
Regardless of age, there will still be a demand for in-store services, but how we alter and convince users to transit doing online services makes the difference. If there was time, we would speak to the ground staff to have clarity on their pain points. We would also do more testing and refine other aspects of the user interaction, such as adding Quetips on each icon to give a little information before the user navigates further. Experiment with ways to use technology to explore different products online. Account for more accessibility for a wider range of users.
LIVE SITE
You may visit the live site and observe from the link here; https://www.att.com/online/wireless/
MORE WORKS


Ridwan Madon © Copyright 2009-2026. All Rights Reserved.